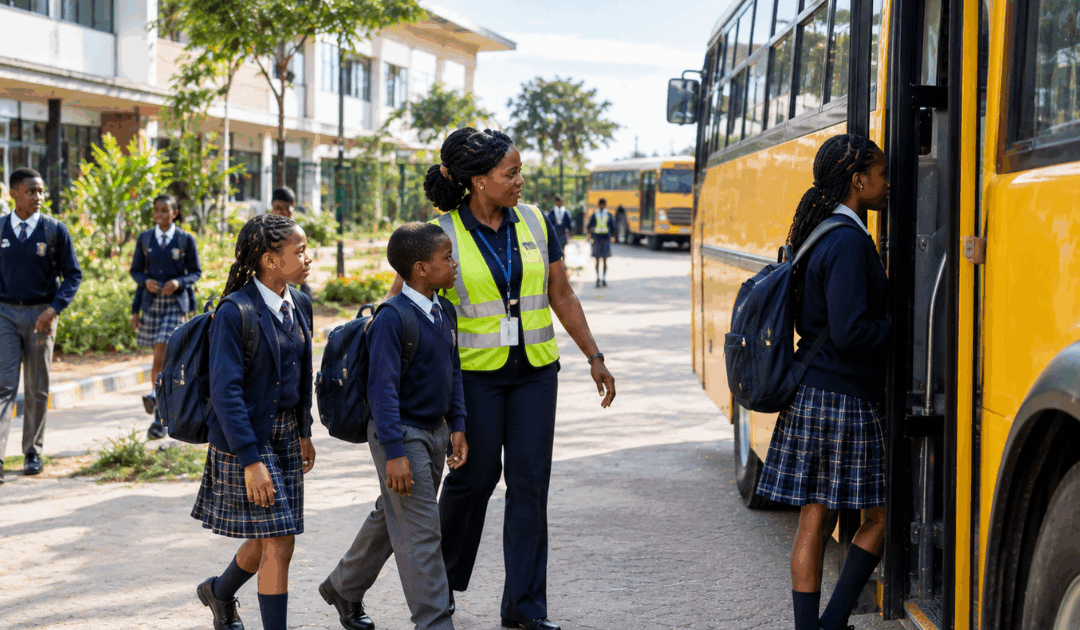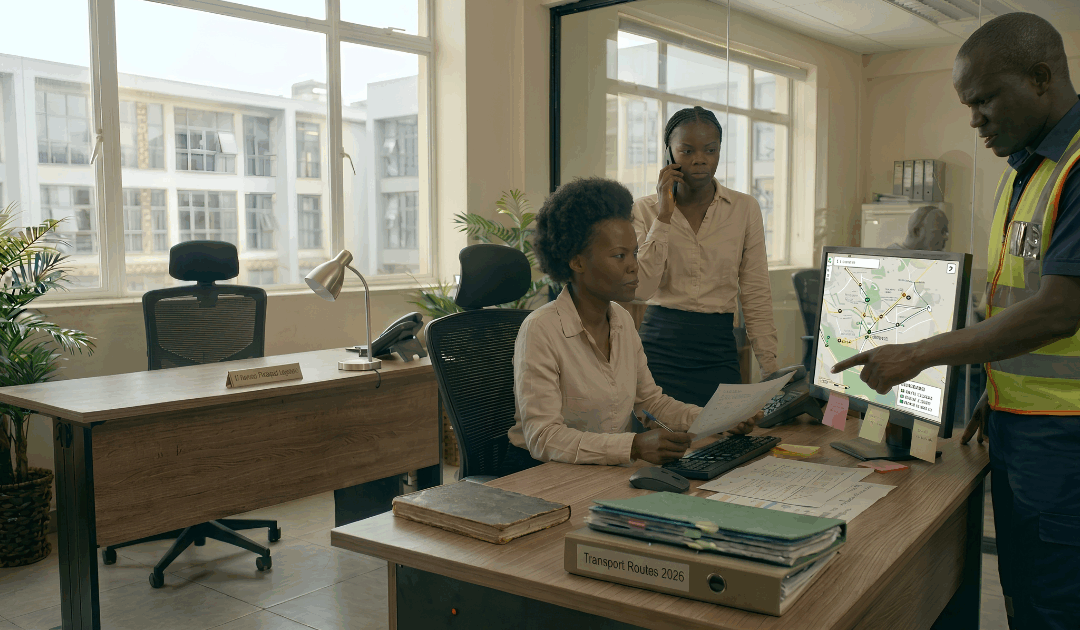

A school bus arrives fifteen minutes late. A parent calls to ask why. The transport office pulls up the day’s journey record; a delay caused by traffic near the junction, nothing unusual, and gives the parent a clear answer. The question is resolved in minutes.
Then, the following week, the same route is late again.
At what point does a school stop investigating individual incidents and start asking a different question? Most schools today can answer “where’s the bus?” reasonably well; live tracking has made that part routine. Journey records can also help explain what happened on a particular trip. The harder, more valuable question is the one that only shows up over time: not what happened on a single journey, but what keeps happening.
Real-time information tells a school what is happening right now. Reviewing that information over time reveals what keeps happening, and understanding that distinction changes how a school should think about its transport data altogether.
Real Time: What’s Happening Right Now?
Live tracking answers the most immediate question a transport team has: where is the bus, and is it on schedule right now? It’s what lets a school respond in the moment: seeing when a bus is running behind schedule, confirming a route is on track, or responding to a parent while the journey is still underway.
But real-time visibility only ever answers questions about the present. Understanding what happened and what keeps happening requires stepping back from the live view and looking at the data after the fact.
Daily: What Happened Today?
At the end of each day, there’s value in a quick look back at what actually took place across the school run: delays, completed journeys, boarding records, anything that deviated from the plan, and any exception worth a note.
This isn’t about combing through every data point every evening. It’s about knowing enough of the day’s activity to catch something that shouldn’t be ignored, a boarding record that looks off, a route that ran unusually long, or a pickup that took significantly longer than expected. Daily review is light-touch by design. Its job is simply to make sure nothing slips through while it’s still fresh enough to act on.
But a single day rarely tells the full story.
Weekly: Is This Happening Again?
One late journey may be unavoidable: traffic, weather or a one-off delay at a pickup point. Three late journeys on the same route in the same week is a different matter entirely.
A weekly review is where individual events start to become something more useful: a pattern. It can surface things a single day’s view never would: a route that’s repeatedly behind schedule, a particular pickup point where delays keep recurring, boarding records that reveal recurring discrepancies, or whether a change made two weeks ago has actually improved anything.
One journey tells you what happened. Several journeys can start telling you why it keeps happening.
This is the point where transport data stops being a record of individual events and starts becoming a tool for understanding the system as a whole, which routes are performing consistently, which are experiencing recurring problems, and where attention actually needs to go.
Monthly or Termly: What Is the Bigger Picture?
Zoomed out further, a monthly or termly review asks a different kind of question. Not “Did this route run late this week?” but: Is this route consistently harder to operate than others? Have delays trended up or down over the term? Are the same operational issues showing up again and again, regardless of what’s been tried? What should change before the next term starts?
This isn’t about generating more reports for their own sake. It’s about giving school leadership the kind of picture that only becomes visible once enough time has passed, separating a temporary hiccup from a persistent, structural problem. A route that’s had one bad week might just have had a bad week. A route that’s had a bad week every month for a term is telling you something.
That’s what turns a termly review into a planning tool rather than just a record: it doesn’t only tell a school what happened, it helps inform what to do differently, which routes may need adjustment, which pickup times need reviewing, and what to plan for before the next term begins.
The Quiet Gap: When Data Exists but Nobody Is Looking
Here’s the thing many schools don’t notice until it’s pointed out; it’s entirely possible to have a sophisticated transport tracking system, full of accurate, real-time data, and still be using almost none of it.
A few signs this might be happening:
- No one person or role clearly owns reviewing the data
- It only gets opened after a complaint or an incident, never before
- Reports get generated but rarely get discussed
- Basic performance questions, like average delay time or which routes experience the fewest recurring delays, don’t have quick answers
- The same issues keep recurring without ever being flagged as a pattern
None of this is a failure of the technology. The tracking works fine; the data is there, accurate and available. What’s missing is the habit of looking at it. Technology can make information available. It cannot decide whether the organisation pays attention to it.
A Practical Review Rhythm
There’s no single correct frequency for reviewing transport data; different questions call for different timeframes. The useful approach is matching the review to the question you’re actually trying to answer:
| Review frequency | Main question |
| Real time | What’s happening right now? |
| Daily | What happened on today’s journeys? |
| Weekly | Is something happening repeatedly? |
| Monthly / Termly | What does the longer-term pattern tell us? |
| As needed | What happened during a specific incident or complaint? |
Try This Without Opening Your Dashboard
Before opening your dashboard, see how many of these questions you can answer:
- Which route has had the most recurring delays recently?
- Could you identify a pattern in pickup performance over the past month?
- Has your transport data changed a decision at your school recently?
- If a parent asked about a journey from three weeks ago, could you clearly explain what happened?
If several of these are hard to answer, the issue probably isn’t a lack of data. Most schools with a tracking system in place have plenty of it. The more likely gap is a consistent way of actually reviewing it.
What Makes This Possible?
Meaningful review at any of the frequencies above depends on having information that’s consistently captured, easy to access, structured in a way that makes sense, and available historically, not just in the moment.
This is the layer that Bunifu Go is built around: real-time vehicle visibility, student boarding records, journey history, and reporting that connects the different parts of a school run rather than leaving them scattered across separate systems. The goal isn’t to help schools collect more data. It’s to make the information a school already needs available when it actually needs to understand what happened, not just in the moment, but over a week, a month, or a term.
Where is the bus? What happened? Is it happening repeatedly? What does the pattern tell us? Each question builds on the one before it, and the later questions depend on having the earlier information captured consistently along the way.
Data Becomes Valuable When Someone Uses It
Go back to that late bus at the start. In the moment, the question was simple: why was the bus late today? But once the same route is late for the third week running, the more useful question isn’t about today at all. It’s why does this keep happening?
Real-time tracking helps a school respond. Daily review helps it account for what happened. Weekly and termly reviews reveal the patterns that no single journey ever could.
The data needed to answer many of these questions may already be sitting in your system. Reviewed regularly, it stops being a record of what happened and starts shaping what your school does next.