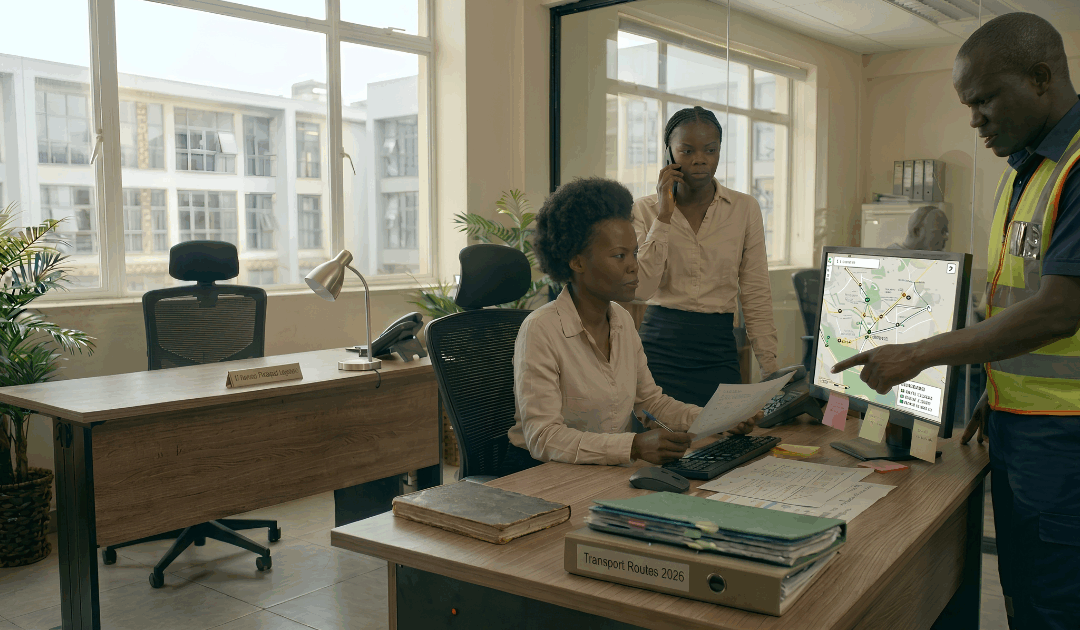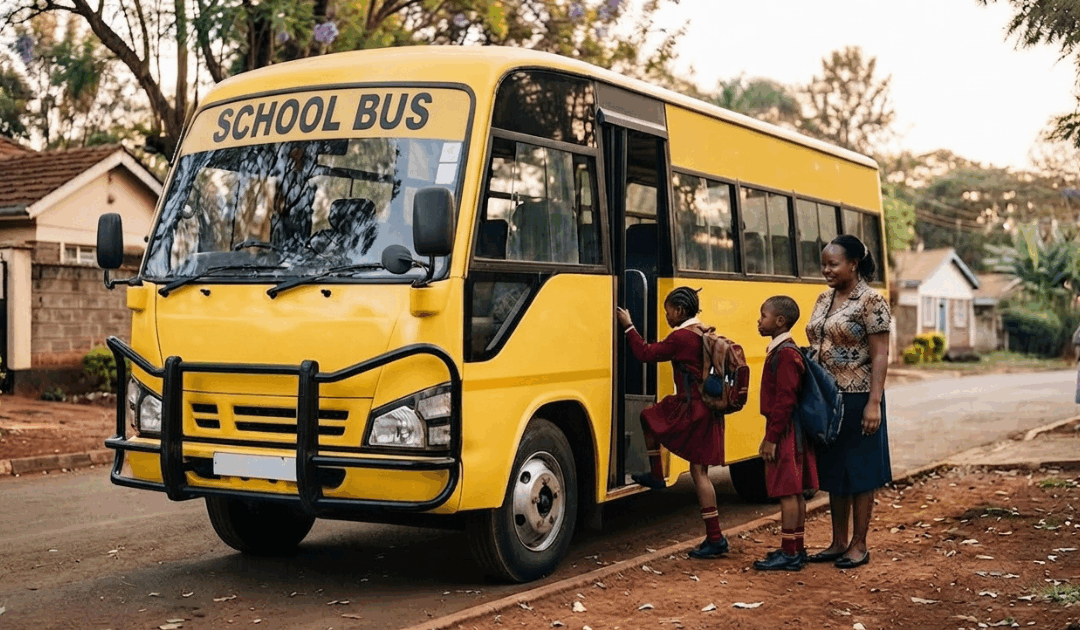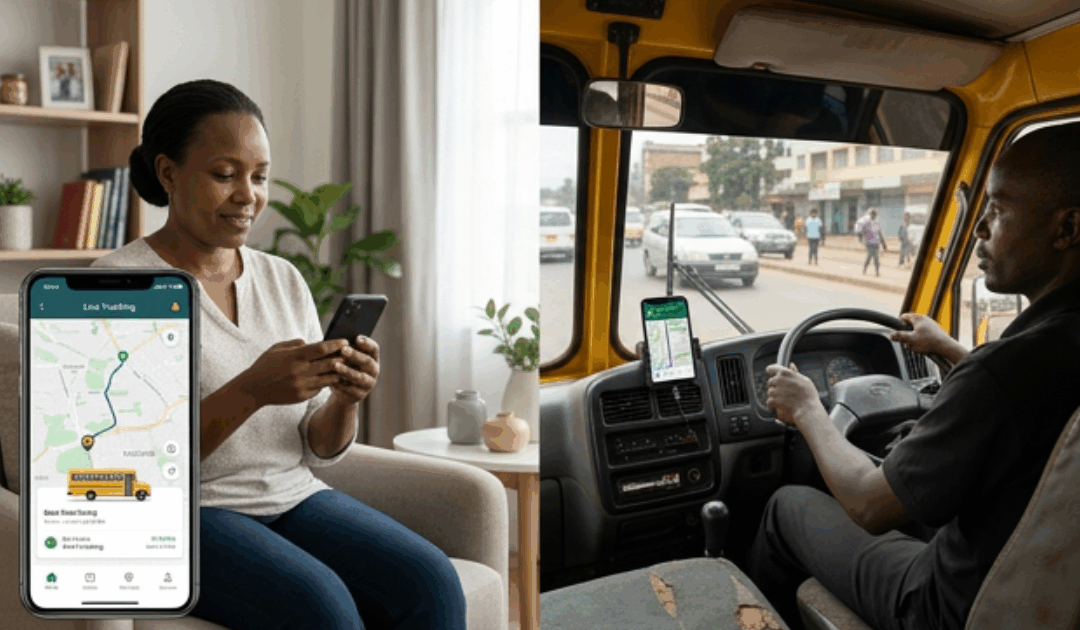
When a bus runs late, parents want to know where it is and when it will arrive. The school office may start calling the transport team, which then tries to reach the driver. Meanwhile, nobody has a clear answer to give the parent.
It’s a small moment, but it points to a bigger problem: when transport information isn’t readily available, even a simple delay becomes difficult to explain. And when the same issues keep happening, they can be hard to spot without a way to measure them. A route that’s consistently late or a vehicle regularly running below capacity may go unnoticed until complaints start to build.
So, what should schools actually be measuring to understand their transport operations and identify where improvements are needed?
Tracking isn’t the same as measuring
It’s worth drawing a distinction early on: tracking tells you what happened. Measuring helps you spot the pattern.
Knowing a bus arrived at 7:48 is useful on its own. Knowing it was scheduled for 7:30 and has arrived late on the same route four Mondays in a row is far more actionable. The value of transport data isn’t in collecting it. It’s in noticing what repeats.
Six metrics that matter
On-time performance. Track actual pickup and drop-off times against the schedule, by route, over time. A single late morning might be traffic. A route that’s late every Monday is a scheduling problem worth investigating, not bad luck. Once you see the pattern, you can look at the timing, the stop order, or the route itself.
Ridership vs. capacity. Compare how many students are actually using each route against the vehicle’s capacity. It’s common for one bus to run consistently near-empty while another is close to full. That imbalance is easy to miss day to day but obvious once you’re looking at the numbers, and it’s exactly the kind of thing worth factoring into route planning or vehicle allocation.
Route efficiency. Look at journey time, number of stops, and distance relative to how many students a route actually serves. If two routes cover a similar number of students but one takes twice as long, the stop sequence, not necessarily the distance, may be the issue. Reviewing stop order and placement can shave meaningful time off a route without cutting anyone from it.
Incident and safety records. Log breakdowns, delays, and near-misses consistently, not just when something serious happens. One late arrival is an incident. The same vehicle experiencing repeated breakdown-related delays over several weeks is a pattern, and it’s the same logic behind tracking driver performance: problems are easier to address when patterns are identified early rather than after a parent complaint.
Communication performance. Measure how quickly a delay or issue gets flagged and passed along to the people who need to know; parents included. If parents are already calling the school before the school knows there’s a delay, that gap is worth closing. It’s often less about the delay itself and more about how long people are left without useful information.
Journey consistency. Look at how predictable a route’s performance is day to day, not just whether it’s on time, but whether it behaves the same way each time it runs. A route that takes 45 minutes some days and over an hour on others isn’t predictable, even if it’s “on schedule” on average. Part of what makes a route difficult to understand is that location alone doesn’t tell the full story, knowing where the bus is matters, but knowing which students were recorded as boarding can provide additional context about the journey.
How to start tracking without adding more admin work
None of this requires measuring everything at once. A simple way to start:
- Pick two or three metrics that relate directly to your school’s biggest current transport headaches, not all six from day one.
- Review the numbers weekly, rather than waiting for a complaint to prompt a look.
- Use a tracking tool instead of piecing information together from spreadsheets, phone calls, and driver check-ins. This is what to look for if you’re evaluating options.
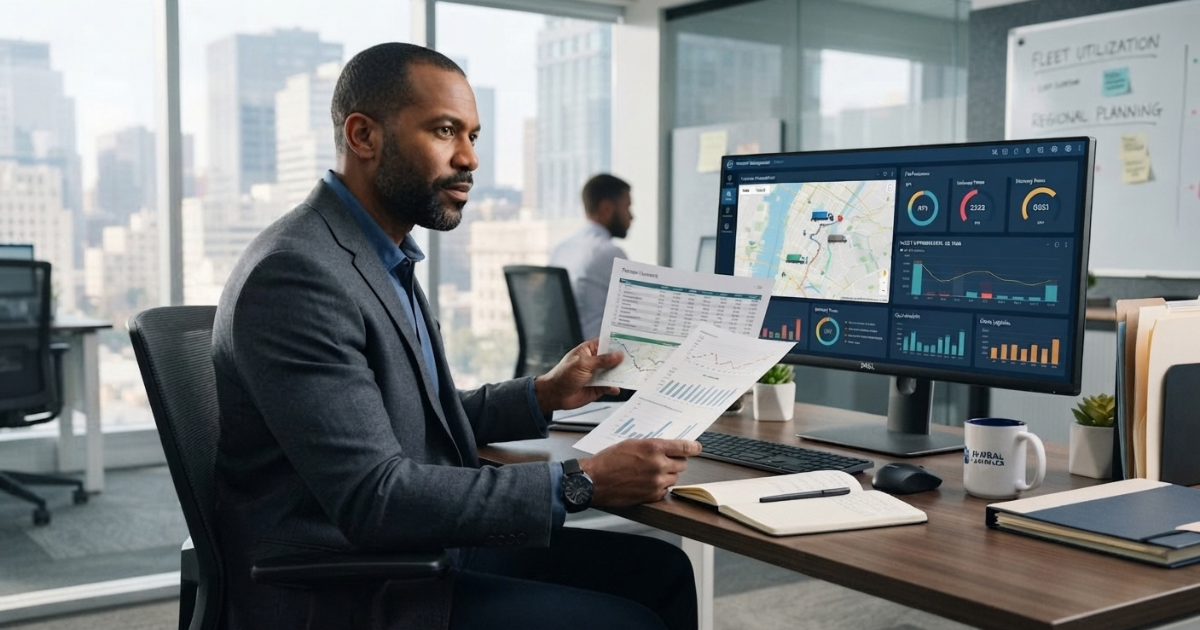
That last point matters more as a school’s transport operation grows. Manual tracking that works fine for three routes gets unwieldy fast at ten. The goal isn’t to create more administrative work; it’s to make the information that already exists easier to see and act on.
From guesswork to knowing
Picture that same late bus again. A parent calls, worried, asking where it is.
This time, the transport team doesn’t need to start making calls to piece together what happened. They already have the relevant journey information available. They can see where the bus is, review the journey data, investigate what caused the delay, and give the parent a clearer answer.
The goal was never to collect more transport data for its own sake. It’s to turn the data schools already generate every day into decisions that make the next journey a little smoother than the last.
If your school is still piecing transport information together manually, starting a pilot is a practical way to see how having that information readily available can support better transport decisions.